
Network Monitoring Tools for SMEs: A Practical Buyer's Guide
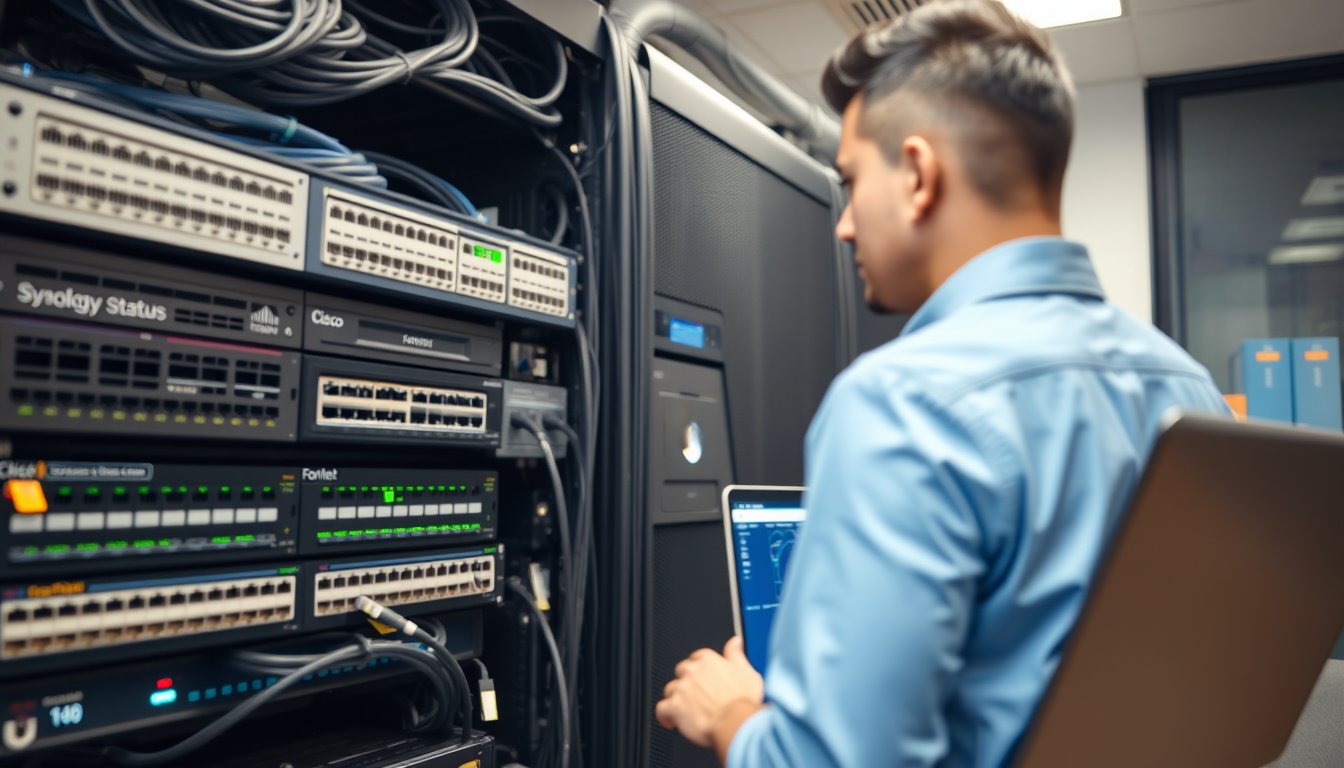
The ₹1.2 lakh lesson from a Peenya manufacturing unit
In March 2024, a 90-person precision-components manufacturer in Peenya called us because their ERP was "slow." Not down. Slow. Their accountant had been re-entering invoices for three weeks because the ERP web UI kept timing out mid-save. Nobody in IT had noticed, because nobody in IT was watching anything except a ping check that ran every five minutes and reported "up."
We installed a proper SNMP collector on their Cisco CBS350 switch stack and within 40 minutes found the problem: a flapping 1 Gbps uplink to the second floor, dropping and re-negotiating roughly every 11 minutes. The switch logged it. The ping monitor didn't, because a 4-second outage never fails a 5-minute interval ping. The uplink had been degrading since a cable puller had run a Cat6 run alongside a 3-phase mains conduit during a partition-wall job. Induced noise. The cable tested fine on a basic continuity tester.
Recabling cost ₹18,000. The switch configuration change to add a redundant path cost ₹6,000. The three weeks of re-entered invoices, the delayed dispatch to two customers, and the overtime to catch up cost the business roughly ₹1.2 lakh in lost productivity. The monitoring tool that would have caught it in minute two costs ₹9,500 a year.
That ratio — ₹9,500 against ₹1.2 lakh — is the entire commercial argument for network monitoring tools in an SME. Not uptime. Not dashboards. Not the joy of watching green lights. It's the ability to see a slow-burning problem before it becomes a finance problem.
This article is for the IT manager or ops head at an Indian company with 20-200 staff who is evaluating monitoring tools right now. I'll cover what to actually monitor, what threshold to set, the agent-versus-SNMP decision, why alert fatigue kills more deployments than budget does, and what open-source versus commercial really costs once you count your own time. Where our own approach at SynergyScape's network solutions practice isn't the right fit, I'll say so.
What to monitor: the four layers that matter
Most SME monitoring projects die because they try to monitor everything. You don't need to monitor everything. You need to monitor four layers, and you need to monitor each of them for a different reason.
Layer 1: The WAN edge
This is your ISP link, your firewall, and everything between your LAN and the internet. For most Bangalore SMEs, this is where the money leaks.
Monitor these specific things:
- Interface utilisation on the WAN port, sampled every 60 seconds. Watch the 95th percentile, not the average. A link that averages 40 Mbps but peaks at 95 Mbps on a 100 Mbps circuit is three months away from becoming your bottleneck.
- Packet loss to a known-good external target (8.8.8.8 or 1.1.1.1). Anything above 0.5% sustained over 15 minutes is a problem. Above 2% and your VoIP calls will sound like a walkie-talkie in a tunnel.
- Latency to your primary SaaS endpoints. If your team lives in Zoho, O365, or a hosted ERP, ping the actual endpoint, not google.com. We've seen SMEs with 8ms to Google and 140ms to their own ERP because routing was asymmetric.
- Firewall session count and CPU. A FortiGate 90G handling 200 users should sit under 60% CPU at peak. If it's pinned at 90% during business hours, you're one firmware bug away from an outage.
Layer 2: The core switch and LAN fabric
This is where the Peenya story lived.
- Per-port error counters — CRC errors, input errors, runts, giants. This is the single most useful diagnostic metric in a switched network and almost nobody watches it. A port accumulating CRC errors at more than 1 per 10,000 packets has a physical layer problem: bad cable, bad connector, induced noise, or a failing SFP.
- Spanning-tree topology changes. STP should be boring. If your root bridge is changing more than once a week, you have a loop, a flapping port, or a misconfigured edge port. Every topology change is a brief forwarding pause, and enough of them will make users complain about "the network being slow" without any metric obviously failing.
- Uplink utilisation between switches. A 1 Gbps inter-switch link running at 70% sustained means your east-west traffic is about to cause contention. This is common in offices where the file server and the backup target ended up on the same segment.
- PoE budget. If you're running IP phones, access points, and cameras off the same switch, watch the total PoE draw. Exceed the budget and the switch starts dropping ports — usually the ones you care about least, which is exactly the problem.
Layer 3: Servers and storage
If you're still running on-prem (and plenty of Indian SMEs are, for good reasons — see our note on trade-offs later), monitor the physical health as well as the logical one.
- CPU, memory, and disk queue length on every server. Disk queue length above 2 per spindle sustained is your warning sign. On SSDs, watch latency instead: sustained read latency above 10ms on a business-grade SSD means something is wrong.
- SMART attributes on every disk, especially reallocated sector count and pending sector count. A drive with a rising reallocated sector count is a drive you should be replacing this week, not next quarter.
- RAID status. A degraded array on an unmonitored server is a time bomb. We've walked into offices where the RAID 5 had been running degraded for four months because the alert email was going to a departed employee's inbox.
- Backup job success. Veeam Backup & Replication v12 has a solid REST API. Poll it. A backup that failed silently for three weeks is worse than no backup, because you think you're protected.
- NAS health if you're running a Synology DS923+ or similar. Synology's SNMP support is adequate for basic health; you'll want the vendor's own alerting for volume and drive detail.
Layer 4: Endpoints and the last mile
The hardest layer, because endpoints are numerous, mobile, and often unmanaged.
- Wi-Fi client experience. Not AP status — actual client experience. How many clients have RSSI below -70 dBm? How many are retrying association? A user at -75 dBm will complain about "slow internet" when the real problem is that they're two walls away from the nearest AP.
- DHCP pool exhaustion. Small thing, huge impact. A /24 DHCP scope serving 200 devices with a 1-day lease will run out during a busy Monday. Monitor pool utilisation and alert at 80%.
- DNS response times from a representative internal client. If your internal DNS server is taking 200ms to resolve, every application feels slow, and nobody will be able to tell you why.
Agent vs SNMP: the decision that shapes everything
This is the fork in the road, and picking wrong costs you six months of rework.
SNMP is a protocol built into almost every piece of business networking gear made in the last 20 years. Your FortiGate, your Cisco or Aruba switches, your Synology NAS, your UPS, your printer — they all speak it. You point a collector at them, walk the MIB tree, and you get metrics without installing anything on the device. It polls. It doesn't require an agent to run on the target. It works on devices where you can't install software at all.
Agents are small pieces of software you install on a server or endpoint. They push metrics to your monitoring system. They can see things SNMP can't: process-level CPU, application-specific metrics, custom scripts, log lines, file integrity. They work through NAT and off-network, so they're the only practical option for laptops.
Here's the honest comparison for an SME context:
| Dimension | SNMP polling | Agent-based |
|---|---|---|
| Works on switches, firewalls, printers, UPS | Yes | Rarely |
| Works on Windows/Linux servers | Partially (limited metrics) | Yes, fully |
| Works on roaming laptops | No | Yes |
| Firewall rules required | Collector must reach device | Agent must reach collector |
| Deployment effort | Low, central | Per-device install and update |
| Update/maintenance burden | Low | Real — agents need patching too |
| Detail depth | Device health and interfaces | Process, application, file-level |
| Typical SME role | Infrastructure backbone | Servers + endpoints |
My recommendation for a 20-200 user Indian SME: SNMP for everything that supports it, agents only where SNMP can't see what you need. That typically means SNMP for the network fabric and agents (or agentless WMI/SSH) for servers. For laptops, use whatever your endpoint management tool already provides — don't add a second agent just for monitoring. Two agents on the same laptop is a support ticket waiting to happen.
One specific caution on SNMP: SNMPv2c uses a plaintext community string. It's effectively a password sent in clear text across your network. On a flat SME LAN with guest Wi-Fi, an attacker on the guest network can often read your entire SNMP walk, which leaks your device inventory, interface names, and sometimes usernames. Use SNMPv3 with auth and privacy if your gear supports it (most enterprise gear made after 2018 does; cheaper TP-Link and D-Link switches often don't). Where v3 isn't available, at minimum restrict SNMP access to your collector's IP via ACL and move guest Wi-Fi to a separate VLAN.
Thresholds: where to set them so you actually get value
A threshold set too tight produces noise. Too loose produces silence. Here's a starting table for a typical Indian SME office, and you should tune from here based on your own baseline.
| Metric | Warning | Critical | Why this number |
|---|---|---|---|
| WAN interface utilisation (95th pct) | 70% | 85% | Above 85% sustained, buffer bloat degrades VoIP and video |
| WAN packet loss (15-min window) | 0.5% | 2% | VoIP breaks around 1-2%; file transfers tolerate more |
| WAN latency to primary SaaS | 80ms | 150ms | Interactive apps feel sluggish above 150ms round-trip |
| Switch port CRC errors | 1 per 10,000 pkts | 1 per 1,000 pkts | Anything above warning implies a physical fault |
| Core switch CPU | 60% | 80% | Control-plane protection; spikes above 80% risk STP/OSPF instability |
| Server disk free | 20% | 10% | SQL Server, Exchange, and most line-of-business apps behave badly below 10% |
| Server disk latency (SSD) | 10ms | 25ms | Business SSDs degrade sharply past 25ms |
| RAID degraded | Any | Any | Treat as critical from second one — no warning tier |
| Backup job failure | 1 consecutive | 2 consecutive | Two failures means it isn't a transient blip |
| DHCP pool utilisation | 80% | 92% | New devices start failing to get addresses above 92% |
| Wi-Fi clients below -70 dBm | 10% of clients | 25% | Above 25% means a coverage problem, not a client problem |
Two things about these numbers.
First, they are starting points, not gospel. A 24x7 BPO will have different tolerance for packet loss than a design studio that does mostly file transfers. Baseline your own network for two weeks before you set anything tight, or you'll spend that fortnight chasing ghosts.
Second, alert on trends, not just breaches. A WAN link that's gone from 40% to 65% to 80% over six weeks is telling you something will break in three weeks. A single 85% spike at 11am on a Monday is probably a Windows Update wave. Trend alerts catch capacity problems; threshold alerts catch incidents. You need both.
Alert fatigue: the disease that kills monitoring projects
The number one reason SME monitoring deployments get abandoned within a year is not cost. It's noise.
Here's the pattern. You install Zabbix or PRTG or ManageEngine OpManager. You turn on the default templates. Within 48 hours, your inbox is getting 200 emails a day and your phone is buzzing on WhatsApp. Your team starts ignoring alerts. Six weeks later, someone opens the dashboard for the first time in a month, sees 4,000 unacknowledged alerts, and closes the tab. Three months later, nobody looks at the tool at all. You've paid for a monitoring system that monitors nothing.
We've walked into Bangalore offices where this had been the situation for two years. The tool was installed. The licences were paid. Nobody was watching.
How to stop it before it starts
Start with ten alerts, not a thousand. Pick the ten metrics that would cause an actual business problem if they went wrong. Peenya example: switch port CRC errors, WAN loss, WAN latency to ERP, RAID status, backup job success, disk free on the file server, DHCP pool, firewall CPU, server CPU on the ERP box, and one Wi-Fi metric. Ten. Get those alerting cleanly before you add anything else.
Every alert must have an owner and an action. If nobody knows what to do when the alert fires, it's not an alert — it's a notification. Write a one-line runbook for each: metric, threshold, who gets paged, what they check first, what they escalate to.
Route by severity, not by default. Critical alerts go to phone/SMS (or WhatsApp via something like a webhook to a group — practical and works well in Indian offices). Warning alerts go to email. Info alerts go to a dashboard nobody has to look at unless they're investigating. Never let a disk-space warning wake someone at 2am.
Suppress during known events. Patching window? Suppress the reboot alerts. Power maintenance scheduled with BESCOM? Suppress the UPS alerts. Suppression rules are the difference between a monitoring tool and an anxiety machine.
Review the alert log weekly for the first three months. Look at every alert that fired and ask: was this actionable? If not, tune the threshold or delete it. This weekly review is boring and it's the single highest-value thing you can do to keep the project alive.
Don't monitor things you can't act on. If your ISP's upstream is flapping and all you can do is phone them, monitoring it produces alerts you can only acknowledge. Monitor it once, in a weekly report, not in real-time.
Open-source vs commercial: the effort cost nobody tells you about
Let's do this properly with numbers. The open-source-versus-commercial debate in SME monitoring is usually conducted on licence fees alone, which is misleading. The real comparison is total cost of ownership over three years, and it includes your team's time.
The open-source option: Zabbix, LibreNMS, Nagios, Prometheus
Zabbix 7.0 is a genuinely excellent product. LibreNMS is excellent for network device monitoring specifically, with strong auto-discovery via SNMP and a nice UI. Nagios Core is old but still works. Prometheus plus Grafana is superb for modern infrastructure but has a steep learning curve for a team that isn't already comfortable with time-series databases.
Zero licence cost. Real implementation cost. Here's what a realistic 50-user deployment looks like:
- A Linux VM to run it (you already have the hypervisor): effectively free
- Install, configure, and get basic SNMP polling working for switches and firewall: 20-40 hours
- Add server monitoring, disk checks, backup API integration: another 20-30 hours
- Build dashboards that your team will actually use: 15-25 hours
- Set thresholds, tune alerts, write runbooks: 15-25 hours
- Ongoing tuning, upgrades, and template maintenance: 4-8 hours per month
If your internal IT person costs ₹6 lakh a year, their loaded hourly rate is roughly ₹400 (with a 20% overhead for PF, gratuity, and so on). Doing the math:
| Phase | Hours | Cost at ₹400/hr |
|---|---|---|
| Initial install and basic polling | 30 | ₹12,000 |
| Expansion to servers and backups | 25 | ₹10,000 |
| Dashboards | 20 | ₹8,000 |
| Thresholds, alerts, runbooks | 20 | ₹8,000 |
| Ongoing (36 months × 6 hrs) | 216 | ₹86,400 |
| Three-year total (internal staff time) | ₹1,24,400 |
That's before any hardware, before any time to actually investigate what the alerts mean, and before the risk that your IT person leaves and the Zabbix instance becomes a mystery nobody understands. Which happens constantly. We've inherited Zabbix installations where the previous admin had hardcoded a password into a template and left no documentation; recovering them costs more than a fresh install.
The commercial option: PRTG, ManageEngine OpManager, Auvik, Paessler
Licence costs for 2026, realistic Indian pricing:
| Product | Licence model | 50-device cost (approx.) | Best fit |
|---|---|---|---|
| PRTG 500 | Per sensor | ₹65,000-₹85,000/year | Mixed environments, easy setup |
| ManageEngine OpManager | Per device | ₹80,000-₹1,20,000/year | Indian vendor, strong support |
| Auvik | Per device, cloud | ₹1,400-₹2,000/device/year | Multi-site SMEs, cloud management |
| WhatsUp Gold | Per device | ₹1,80,000-₹2,50,000/year | Larger SMEs with compliance needs |
| Nagios XI | Per node | ₹90,000-₹1,50,000/year | Teams that already know Nagios |
PRTG's sensor pricing is the trap most people fall into. A single switch might consume 20-40 sensors depending on how you configure it, so a "500-sensor" licence can be consumed by ten devices if you're not careful. Plan your sensor count before you buy. PRTG's own estimator tool can help, but expect a real deployment to consume more sensors than you think.
ManageEngine OpManager is worth a serious look for Indian SMEs because the vendor is Indian (Zoho group, Chennai), support is in Indian time zones, and the product is designed for mid-market budgets. Pricing in our experience runs ₹80,000-₹1,20,000 per year for a 50-device deployment, negotiated. Trade-off: it's not as elegant as PRTG, and the UI is busier than Auvik's.
The real comparison, honestly stated
Three-year TCO for a 50-device, 60-user SME:
| Approach | Three-year cost | What you get | What you don't |
|---|---|---|---|
| Open-source (Zabbix) + internal staff time | ₹1.2-₹1.5 lakh | Full functionality, full control | Your team owns it forever; hiring risk |
| Commercial licence + internal staff | ₹2.8-₹3.8 lakh | Better UI, vendor support | Still need staff time to use it |
| MSP-managed monitoring (SynergyScape or similar) | ₹1.8-₹2.6 lakh (typically ₹15,000-₹22,000/month × 36) | Team does the watching, tuning, and response | Not right if you have a large internal IT team |
When the open-source option is right: you have a competent Linux-fluent IT person, you're comfortable owning the ongoing tuning, and your environment is stable enough that you don't need vendor support at 2am.
When open-source is wrong: your IT person is a generalist Windows admin, you've had staff turnover in the last 18 months, or your business depends on the network being up during business hours with no tolerance for weekend debugging. In those cases, the licence cost is cheaper than the third time you spend a Sunday rebuilding templates.
When an MSP-managed approach is right: your internal IT is one or two people who are already stretched, you want the monitoring to actually result in action, and you're fine with the tool living at the MSP end rather than yours. Which brings us to the trade-offs.
Where this approach is not right for you
Three honest cases where you should not go down this path with us or with anyone.
Case 1: You have a genuine 24x7 NOC team. If you employ 5+ network engineers with monitoring on their dashboards, buy the commercial tool yourself and run it internally. An MSP middle layer will slow you down. Go buy PRTG or OpManager and get on with it.
Case 2: You're in a regulatory environment that requires you to hold your own telemetry. Some BFSI and healthcare workloads require monitoring data to reside on-premise under your own control. In those cases, self-hosted Zabbix, LibreNMS, or on-premise OpManager are the answer, no matter how good the managed alternative is. We'll happily help you set one up on your own infrastructure — see our network solutions page — but the managed SaaS model is not appropriate here.
Case 3: You have fewer than ten network devices and no real users complaining. A 15-person office with one router, one switch, and a NAS doesn't need a monitoring platform. It needs a good backup, a decent UPS, and someone who notices when things break. Spending ₹1.5 lakh over three years on monitoring a network that small is malpractice. Save the money and spend it on a proper firewall.
What actually happens in a real deployment
Let me give you the concrete version of what a 50-user Bangalore office deployment looks like, because the timelines I see quoted by vendors are fantasy.
Week 0: Baseline. Collect SNMP data from your core devices at low frequency without any alerts. Just look at what normal is. You cannot set thresholds without this. Skipping this step is why people complain about alert noise.
Week 1-2: Install a collector. For a 50-user shop, we typically run Zabbix on a 4 vCPU / 8 GB Linux VM, or a PRTG 500 on a Windows Server 2019+ VM with 4 vCPU and 8 GB. Add SNMPv3 credentials to switches, firewall, UPS. Set the first five alerts: WAN loss, switch port CRC errors, RAID health, backup job failure, disk free on the file server.
Week 3-4: Add server monitoring. CPU, memory, disk queue, SMART. Configure backup API polling (Veeam v12 REST API is well-documented). Add the first dashboard for your IT person to look at every morning.
Week 5-6: Tune alerts. By now you'll have fired at least 50 alerts. Half of them were noise. Tune thresholds, add suppressions, write runbooks for the ones that were real.
Week 7-8: Add endpoint and Wi-Fi layer where your kit supports it. Enable DoS on your access points. Add a DHCP pool alert. Add a DNS latency probe.
Week 9-12: Steady state. Weekly alert review. Add a new metric every fortnight based on what you find. By month three, your tool should be generating 5-15 actionable alerts per week, all of which someone does something about.
That timeline assumes someone is on it. If it's a side project for a stretched IT person, double the timeline. That's not a criticism — it's reality.
Bangalore-specific considerations
A few things that matter here and don't elsewhere, without forcing local colour where it's irrelevant.
ISP lead times. A new business broadband circuit from Airtel or ACT in Bangalore typically takes 3-7 working days if you're in a lit building, and 3-6 weeks if fibre needs to be pulled to your floor. Some Jio business circuits we've ordered have taken over six weeks in parts of Whitefield and Electronic City. Plan capacity upgrades accordingly — if your monitoring tells you in November that you'll exhaust bandwidth in January, you have time. If it tells you in December, you don't.
Power reliability. Even in well-serviced parts of Bangalore, brief brownouts and voltage dips are common. Your monitoring should include UPS battery health, UPS load, and input power events. An APC Smart-UPS 1500 with network management card (AP9631) will report battery health and input voltage over SNMP — that's worth the ₹8,000-₹12,000 the card costs. Server power supplies failing after repeated dips is a common cause of "mystery" reboots.
Monsoon effects. Between June and October, cabling health matters more. Water ingress into outdoor runs, degraded connectors in damp risers, and induced noise from moisture-affected earths all show up as CRC errors. If you're running Zabbix without port error monitoring, monsoon problems are invisible until they cause an outage.
GST. Monitoring software and subscriptions attract 18% GST, and if you buy from an overseas vendor, you may be liable for tax under reverse charge mechanism (RCM). Factor this into budgeting — a US$1,000 SaaS subscription is not just ₹84,000, it's ₹84,000 plus RCM compliance work, plus FEMA/FIRA reporting if payments go abroad. Indian vendors like ManageEngine avoid this complexity.
CERT-In and DPDP. If your monitoring includes any log collection or captures traffic metadata, you're subject to CERT-In's 2022 directions on log retention (180 days) and incident reporting (6 hours for specified incidents). DPDP Act 2023 also applies if telemetry includes personal data — usernames, IP addresses mapped to individuals, and similar. For most SMEs, the practical steps are: retain logs for 180 days minimum, document your data flow, and don't ship telemetry abroad if you can avoid it. We've written about compliance obligations for Indian businesses here if you need help mapping your specific situation.
A concrete story: when "no monitoring" cost ₹14 lakh
One more case, because it demonstrates the point better than any table.
A 140-person logistics company in north Bangalore spent the first few days of a critical quarter firefighting a "slow network." Their transport management system was timing out intermittently, dispatch staff were calling customers to apologise, and the usual culprit — the ISP — was denying any problem.
They called us on day three. We put a temporary LibreNMS instance on a spare VM within four hours and had SNMP polling on their core switch within the day. Within 24 hours, the trend data told the story: their firewall's session table was peaking at 92% every afternoon between 2pm and 4pm, coinciding with their dispatch rush. The 4-year-old FortiGate 100E was rated for 4.5 Gbps throughput but only 300,000 concurrent sessions — and their growing use of cloud applications plus IP cameras plus a recently added chat tool had pushed sessions well past that ceiling. When the session table fills, the firewall starts silently dropping new sessions, which manifests as timeouts on some applications and not others. The ISP was telling the truth: the WAN link was fine.
The fix took two days: replacement with a FortiGate 100F (session scale roughly doubled), carefully planned firewall rule consolidation to reduce session churn, and one application moved off a chatty protocol. Hardware and labour: ₹3.6 lakh. Cost of the firefighting before we got involved, plus the delayed dispatch of that quarter's shipments and the customer escalations: approximately ₹14 lakh by their own internal estimate.
The point is not that they should have bought a bigger firewall. The point is that for want of a session-count graph, they lost ten times what the monitoring tool would have cost. If they'd been watching that metric for six months, they would have seen the trend and replaced the box on a planned Saturday, not mid-quarter.
FAQ
Q: Do I really need network monitoring for a 30-person office?
Probably yes, but not a full platform. A 30-person office benefits from monitoring on the WAN link, the core switch, the NAS, and the firewall. That's 4-5 devices. Options: a small PRTG licence (₹25,000-₹35,000/year), LibreNMS for free with a bit of setup time, or an MSP-managed approach at ₹8,000-₹15,000/month that includes the response. What you do not need is a full-blown SCOM or SolarWinds deployment.
Q: Can I just use my firewall's built-in monitoring instead of buying a separate tool?
For some things yes, for many no. FortiGate has FortiView for traffic; Cisco has various dashboards. They're fine for the device itself but they don't give you a single view across switches, servers, and backup. Firewall-native monitoring won't tell you your file server disk is 91% full or your backup job failed. It's a starting point, not a complete answer.
Q: What's the cheapest way to get started without a big commitment?
LibreNMS on a Linux VM. It's the least painful open-source option for pure network device monitoring — SNMP auto-discovery is genuinely good, the interface is clean, and it doesn't require a Postgres or time-series database degree. You'll spend 15-25 hours getting it set up and tuned. If you'd rather not own that, PRTG's free tier allows 100 sensors, which is enough to cover a small office for evaluation purposes.
Q: How does SNMP v3 compare with v2c on cost?
SNMPv3 is a protocol, not a licensed product — no cost difference. The cost is in configuration complexity (users, auth, priv) and hardware support. Most enterprise gear supports v3; cheap SME switches may not. For a new deployment in 2026, use v3 wherever it's supported. Where it isn't, ACL-restrict v2c to your collector's IP and isolate guest networks.
Q: What about cloud-first SMEs with no on-premise infrastructure?
If everything is in Azure, AWS, or GCP, use the cloud provider's native monitoring (Azure Monitor, CloudWatch) plus a SaaS tool like Datadog or Grafana Cloud for cross-cloud views. You'll likely need almost no SNMP. The monitoring problem changes shape — it becomes log aggregation and application performance monitoring more than network health. The alert fatigue principles still apply, and arguably matter more, because cloud metrics are noisier by default.
Q: Do I need to monitor 24x7, or is business-hours enough?
Monitor 24x7, alert during business hours unless it's critical. The data collection should never stop — trends don't care about business hours, and off-hours incidents are exactly the ones users don't discover. But alert routing should respect business hours: disk-space warnings should not SMS you at 3am. The exceptions are things that break the next morning if unattended (backup failures, RAID degraded) — those alert immediately.
Q: How is this different from SIEM or log management?
Different tools, different questions. Monitoring answers "is it healthy?" SIEM answers "is it being attacked, and who did what?" They overlap in log collection but the use cases are distinct. A 100-person SME typically needs monitoring first because day-to-day reliability saves more money than security analytics. SIEM becomes worth the money as you grow past 200 users or enter a regulated space. Don't buy a SIEM to solve a monitoring problem.
What to do next: this week
Before you buy anything, do two things this week. It'll take you three hours total and it will save you six figures in wrong purchases.
First, inventory what you already have. Make a spreadsheet: every device on your network that supports SNMP, every server, every NAS, every firewall, every switch, every UPS. Write down the make, model, and whether it speaks SNMPv2c, SNMPv3, or not at all. If more than 30% of your devices don't support SNMP, that alone changes your tool choice. If your core switch is a 10-year-old unmanaged unit with no SNMP, you have a bigger problem than monitoring.
Second, write down the ten questions you'd want answered if your business network had a problem at 10am on a Monday. What would you check first? What would you have wished you'd been alerted to? Those ten questions are your starting alert list. Every monitoring tool decision flows from that list.
Once you've done that inventory, you can make a real decision between open-source self-hosted, commercial self-hosted, or MSP-managed. If you want to shortcut that decision with someone who's done it in Bangalore offices of every size, get in touch with our team. We'll tell you honestly whether your size, team, and environment point to a tool you should run in-house or one we should run for you — and we'll say no if monitoring isn't the right first investment for your specific situation.